
UNITED STATES
SECURITIES AND EXCHANGE COMMISSION
Washington, D.C. 20549
___________________________________
Form
__________________________________________________________
CURRENT REPORT
Pursuant to Section 13 or 15(d)
of the Securities Exchange Act of 1934
Date of Report (Date of earliest event
reported)
___________________________________
(Exact name of registrant as specified in its charter)
___________________________________
| (State or other jurisdiction of incorporation) |
(Commission File Number) | (I.R.S. Employer Identification No.) |
| (Address of principal executive offices) | (Zip Code) |
Registrant’s telephone number, including area
code:
Check the appropriate box below if the Form 8-K filing is intended to simultaneously satisfy the filing obligation of the registrant under any of the following provisions:
Securities registered pursuant to Section 12(b) of the Act:
| Title of each class | Trading Symbol(s) | Name of each exchange on which registered | ||
Indicate by check mark whether the registrant is an emerging growth company as defined in Rule 405 of the Securities Act of 1933 (17 CFR §230.405) or Rule 12b-2 of the Securities Exchange Act of 1934 (17 CFR §240.12b-2).
Emerging growth company
If an emerging growth company, indicate by check mark if the registrant has elected not to use the extended transition period for complying with any new or revised financial accounting standards provided pursuant to Section 13(a) of the Exchange Act. ☐.
Item 7.01. Regulation FD Disclosure.
Starling Oncology, Inc. (the “Company”) has prepared an investor presentation (the “Investor Presentation”) to use in meetings with investors. A copy of the Investor Presentation is furnished as Exhibit 99.1 to this Current Report on Form 8-K.
The information contained in this Item 7.01, including Exhibit 99.1, is furnished and shall not be deemed to be “filed” for purposes of Section 18 of the Securities Exchange Act of 1934, as amended (the “Exchange Act”), or otherwise subject to the liabilities of that section, and such information shall not be deemed to be incorporated by reference into any of the Company’s filings under the Securities Act or the Exchange Act.
Item 9.01 Financial Statements and Exhibits
(d) Exhibits
| Exhibit No. | Description of Exhibit | ||
| 99.1 | Investor Presentation dated November 12, 2026 | ||
| 104 | Cover Page Interactive Data File (embedded within the Inline XBRL document) |
SIGNATURE
Pursuant to the requirements of the Securities Exchange Act of 1934, the registrant has duly caused this report to be signed on its behalf by the undersigned hereunto duly authorized.
| Dated: November 12, 2026 | STARLING ONCOLOGY, INC. | |
| By: | /s/ Minh Merchant | |
| Name: | Minh Merchant | |
| Title: | Chief Legal Officer | |
Exhibit 99.1
Investor Presentation 1 November 2026
Some of the information in this presentation is not historical in nature and may constitute forward - looking statements, which ar e made pursuant to the safe harbor provisions of the Private Securities Litigation Reform Act of 1995. These statements may be identified by the use of forward - looking terminolo gy such as “believes,” “expects,” “anticipates,” “may,” “will,” “should,” “seeks,” “approximately,” “intends,” “plans,” “estimates,” or the negative of these words or other c omp arable terminology. The discussion of financial trends, strategy, plans, projections or intentions may also include forward - looking statements. These forward - looking statements involve risks and uncertainties that could cause actual results to differ materially from those projected, anticipated or implied by such statements. Although it is not possible to pre dict or identify all such risks and uncertainties, they may include, but are not limited to, those described in the Company’s annual, quarterly and current reports (i.e., Form 10 - K, Fo rm 10 - Q and Form 8 - K) as filed or furnished with the Securities and Exchange Commission (SEC). You are cautioned not to place undue reliance on any such forward - looking statements, which speak only as of the date such statements were first made. To the degree financial information is included in this presentation, it is in summary form only and must be considered in the context of the full details provided in the Company’s most recent annual, quarterly or current report as filed or furnished with the SEC. The Company’s S EC reports are available at https://starlingoncology.com under the “Investor Relations” tab. Except to the extent required by law, the Company undertakes no obligation to publicly re le ase the result of any revisions to these forward - looking statements to reflect events or circumstances after the date hereof, or to reflect the occurr ence of unanticipated events. Goals, targets, expectations and/or projections are subject to significant business, economic and competitive uncertainties a nd contingencies, many of which are beyond the control of the Company and its management and are based upon assumptions with respect to future decisions, which are subject to change. Actual results may vary and such variations may be material. Nothing in this should be regarded as a representation by any person that these goals, targets, e xpe ctation and/or projections will be achieved and the Company undertakes no duty to update them. Non - GAAP Financial Measures To supplement the Company’s financial results and guidance presented in accordance with U.S. generally accepted accounting pr inc iples (GAAP), the company uses certain non - GAAP financial measures in this presentation, including Adjusted EBITDA. The company believes that this non - GAAP financial m easure provides useful supplementary information to, and facilitates additional analysis by, investors and analysts. Unaudited Financial Information This presentation contains unaudited financial information. The unaudited financial information has been prepared on the same ba sis as the Company's audited financial statements and, in the opinion of management, reflects all adjustments necessary for the fair presentation of the unaudited f ina ncial information. However, the unaudited financial information contained in this presentation is preliminary and may be subject to change. Accordingly, such financial in formation may be adjusted or may be presented differently in periodic reports or other filings filed by the Company with the SEC, and such differences may be material. In add ition, past performance is not a guarantee or indication of future financial condition and/or results of operations and should not be relied upon for such reason. FORWARD - LOOKING STATEMENTS AND NON - GAAP FINANCIAL MEASURES 2 Starling Oncology | Investor Presentation Disclaimer
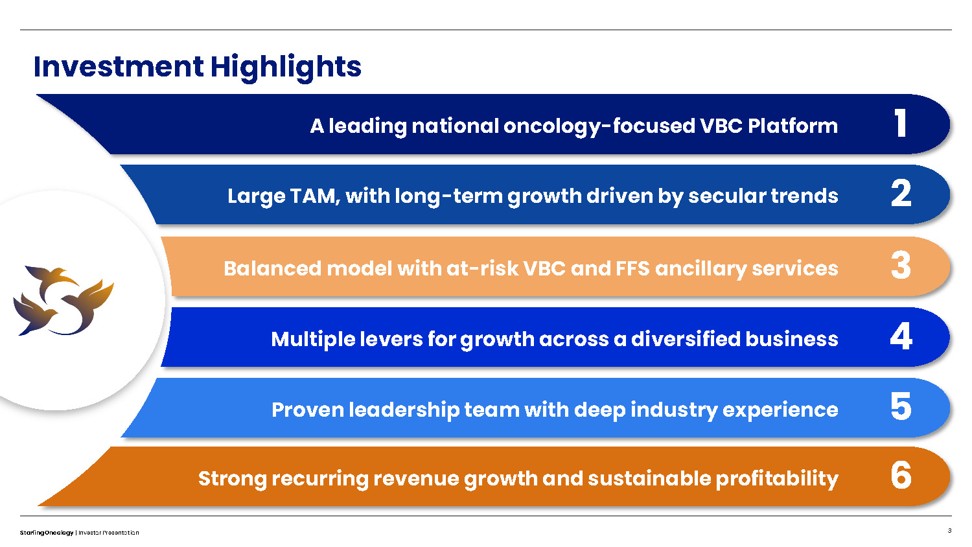
3 Starling Oncology | Investor Presentation 5 4 3 2 1 A leading national oncology - focused VBC Platform Large TAM, with long - term growth driven by secular trends Balanced model with at - risk VBC and FFS ancillary services Multiple levers for growth across a diversified business Proven leadership team with deep industry experience 6 Strong recurring revenue growth and sustainable profitability Investment Highlights
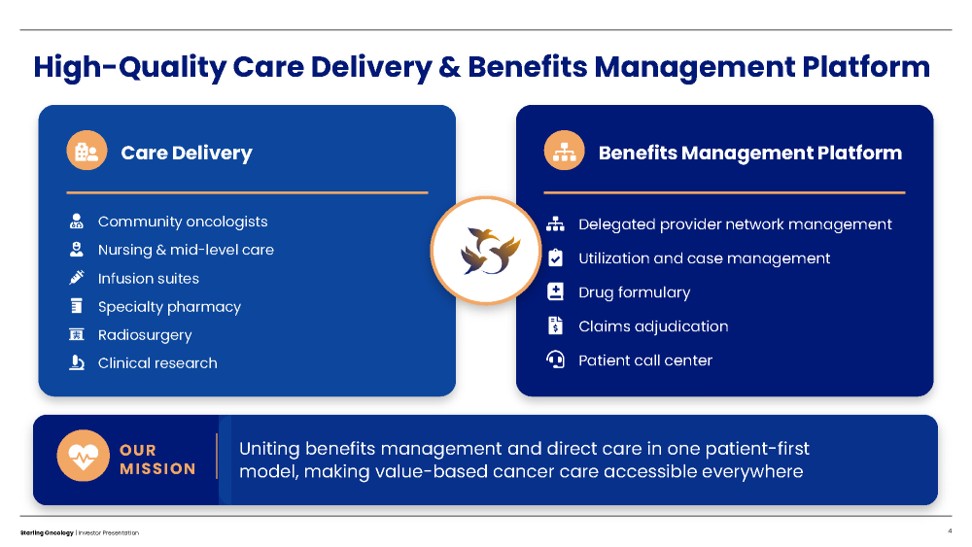
4 Starling Oncology | Investor Presentation High - Quality Care Delivery & Benefits Management Platform Benefits Management Platform Care Delivery Delegated provider network management Utilization and case management Drug formulary Claims adjudication Patient call center Community oncologists Nursing & mid - level care Infusion suites Specialty pharmacy Radiosurgery Clinical research OUR MISSION Uniting benefits management and direct care in one patient - first model, making value - based cancer care accessible everywhere
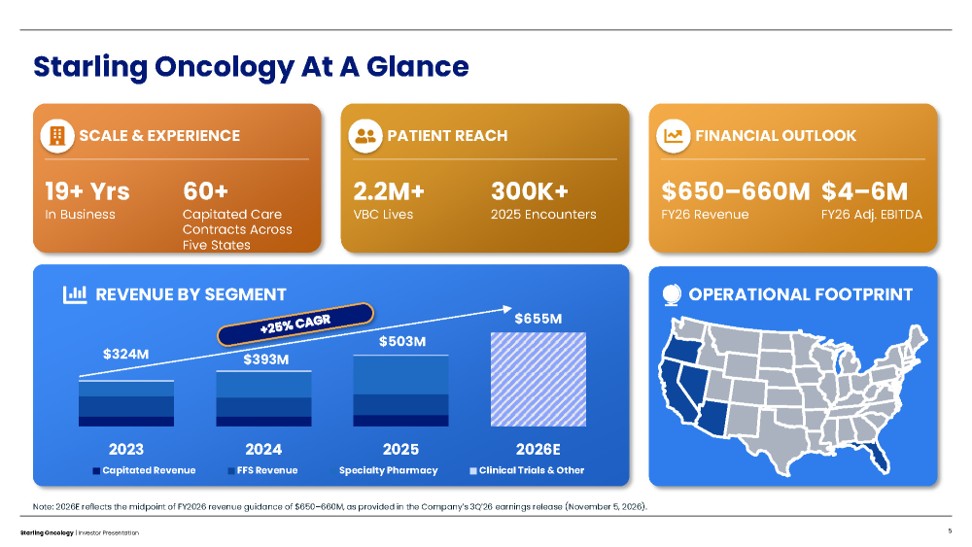
Starling Oncology At A Glance 5 Starling Oncology | Investor Presentation Note: 2026E reflects the midpoint of FY2026 revenue guidance of $650 – 660M, as provided in the Company’s 3Q’26 earnings release ( November 5, 2026). OPERATIONAL FOOTPRINT SCALE & EXPERIENCE 19+ Yrs In Business 60+ Capitated Care Contracts Across Five States PATIENT REACH 2.2M+ VBC Lives 300K+ 2025 Encounters FINANCIAL OUTLOOK $650 – 660M FY26 Revenue $4 – 6M FY26 Adj. EBITDA REVENUE BY SEGMENT $324M $393M $503M $655M 2023 2024 2025 2026E Capitated Revenue FFS Revenue Specialty Pharmacy Clinical Trials & Other
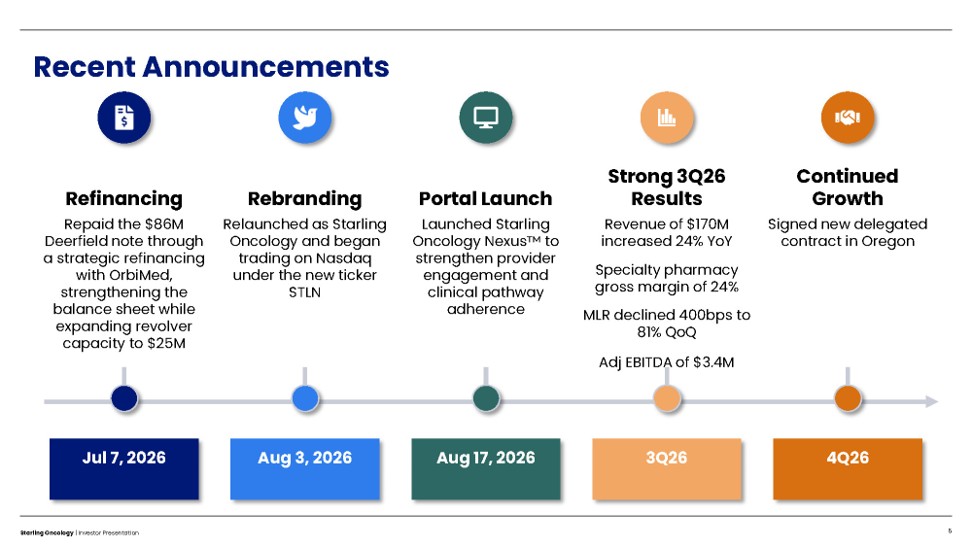
Recent Announcements 6 Starling Oncology | Investor Presentation Jul 7, 2026 Aug 3, 2026 4Q26 Aug 17, 2026 Repaid the $86M Deerfield note through a strategic refinancing with OrbiMed , strengthening the balance sheet while expanding revolver capacity to $25M Relaunched as Starling Oncology and began trading on Nasdaq under the new ticker STLN Signed new delegated contract in Oregon Launched Starling Oncology Nexus to strengthen provider engagement and clinical pathway adherence Refinancing Rebranding Continued Growth Portal Launch 3Q26 Revenue of $170M increased 24% YoY Specialty pharmacy gross margin of 24% MLR declined 400bps to 81% QoQ Adj EBITDA of $3.4M Strong 3Q26 Results
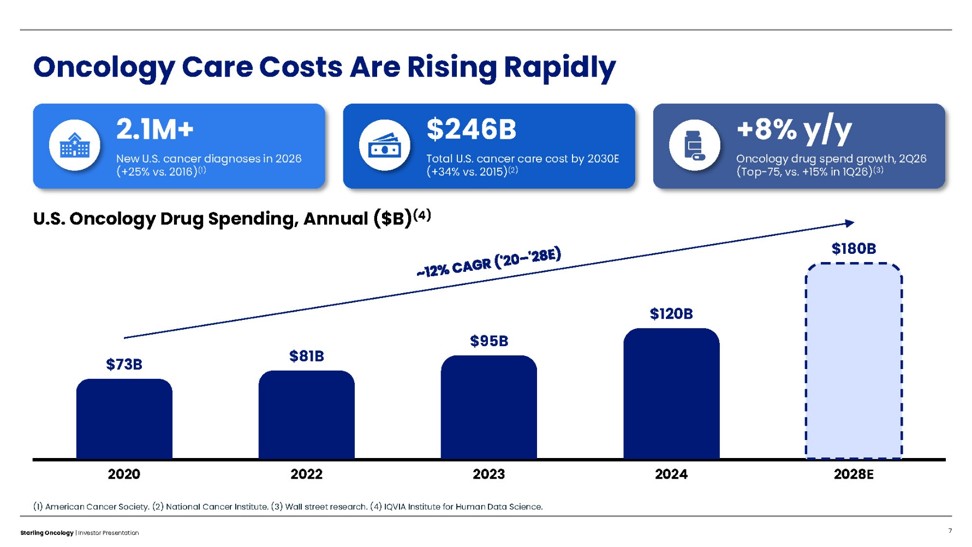
(1) American Cancer Society. (2) National Cancer Institute. (3) Wall street research. (4) IQVIA Institute for Human Data Scie nce . Oncology Care Costs Are Rising Rapidly 7 Starling Oncology | Investor Presentation 2.1M+ New U.S. cancer diagnoses in 2026 (+25% vs. 2016) (1) $246B Total U.S. cancer care cost by 2030E (+34% vs. 2015) (2) +8% y/y Oncology drug spend growth, 2Q26 (Top - 75, vs. +15% in 1Q26) (3) U.S. Oncology Drug Spending, Annual ($B) (4) 2020 2022 2023 2024 2028E $73B $81B $95B $120B $180B
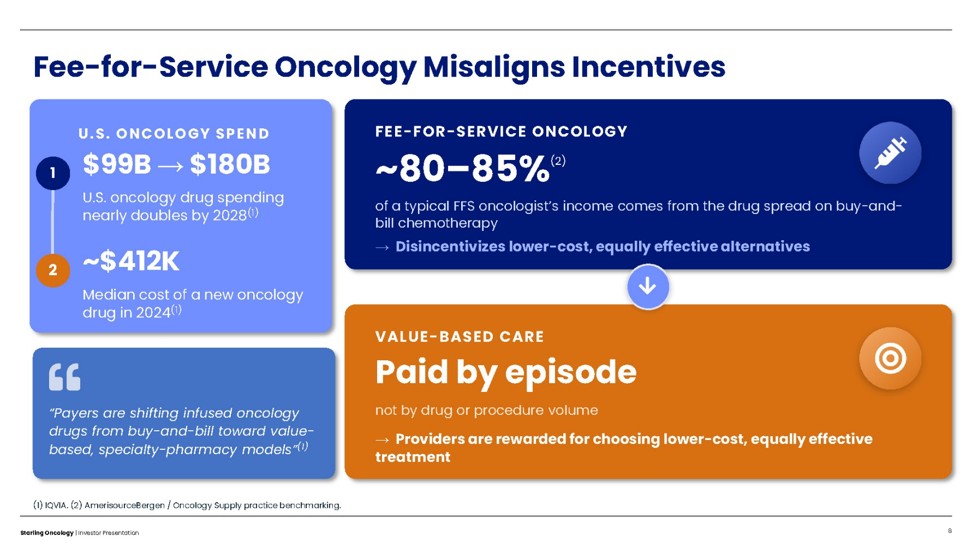
(1) IQVIA. (2) AmerisourceBergen / Oncology Supply practice benchmarking. Fee - for - Service Oncology Misaligns Incentives 8 Starling Oncology | Investor Presentation U.S. ONCOLOGY SPEND 1 $99B → $180B U.S. oncology drug spending nearly doubles by 2028 (1) 2 ~$412K Median cost of a new oncology drug in 2024 (1) “Payers are shifting infused oncology drugs from buy - and - bill toward value - based, specialty - pharmacy models” (1) FEE - FOR - SERVICE ONCOLOGY ~80 – 85% (2) of a typical FFS oncologist’s income comes from the drug spread on buy - and - bill chemotherapy → Disincentivizes lower - cost, equally effective alternatives VALUE - BASED CARE Paid by episode not by drug or procedure volume → Providers are rewarded for choosing lower - cost, equally effective treatment
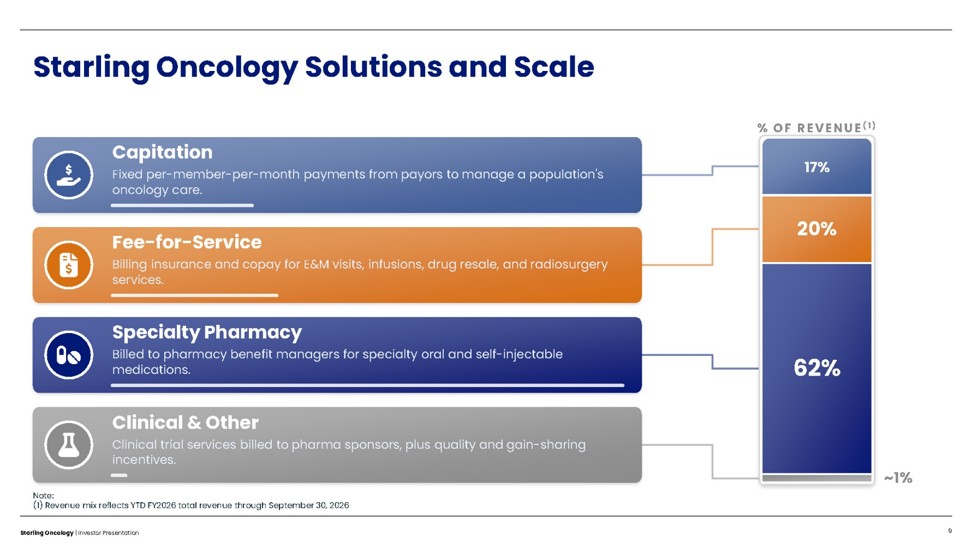
Starling Oncology Solutions and Scale 9 Starling Oncology | Investor Presentation % OF REVENUE (1) Capitation Fixed per - member - per - month payments from payors to manage a population's oncology care. Fee - for - Service Billing insurance and copay for E&M visits, infusions, drug resale, and radiosurgery services. Specialty Pharmacy Billed to pharmacy benefit managers for specialty oral and self - injectable medications. Clinical & Other Clinical trial services billed to pharma sponsors, plus quality and gain - sharing incentives. 17% 20% 62% ~1% Note: (1) Revenue mix reflects YTD FY2026 total revenue through September 30, 2026
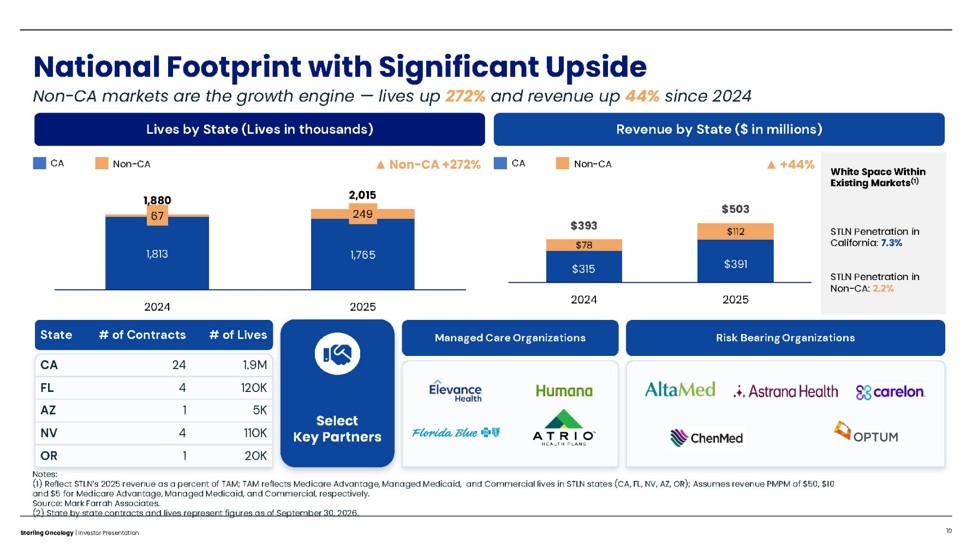
National Footprint with Significant Upside Non - CA markets are the growth engine — lives up 272% and revenue up 44% since 2024 Lives by State (Lives in thousands) Revenue by State ($ in millions) 1,813 1,765 67 249 1,880 2,015 2024 2025 $315 $391 $78 $112 $393 $503 2024 2025 CA Non - CA CA Non - CA White Space Within Existing Markets (1) STLN Penetration in California: 7.3% STLN Penetration in Non - CA: 2.2% Select Key Partners Managed Care Organizations Risk Bearing Organizations ▲ Non - CA +272% ▲ +44% 10 Starling Oncology | Investor Presentation Notes: (1) Reflect STLN’s 2025 revenue as a percent of TAM; TAM reflects Medicare Advantage, Managed Medicaid, and Commercial lives in STLN states (CA, FL, NV, AZ, OR); Assumes revenue PMPM of $50, $10 and $5 for Medicare Advantage, Managed Medicaid, and Commercial, respectively. Source: Mark Farrah Associates. (2) State by state contracts and lives represent figures as of September 30, 2026. # of Lives # of Contracts State 1.9M 24 CA 120K 4 FL 5K 1 AZ 110K 4 NV 20K 1 OR
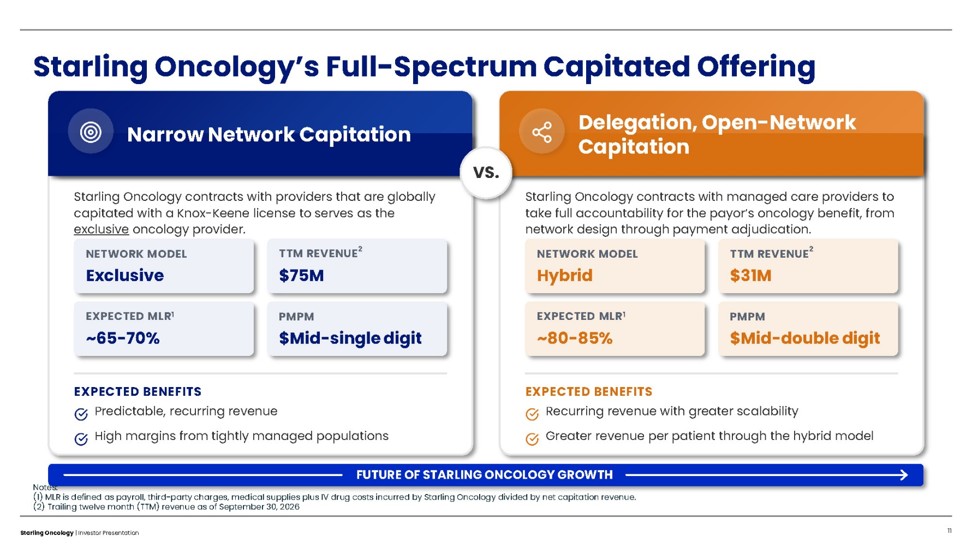
Starling Oncology’s Full - Spectrum Capitated Offering 11 Starling Oncology | Investor Presentation FUTURE OF STARLING ONCOLOGY GROWTH Narrow Network Capitation Starling Oncology contracts with providers that are globally capitated with a Knox - Keene license to serves as the exclusive oncology provider. NETWORK MODEL Exclusive TTM REVENUE 2 $75M EXPECTED MLR 1 ~65 - 70% PMPM $Mid - single digit EXPECTED BENEFITS Predictable, recurring revenue High margins from tightly managed populations Delegation, Open - Network Capitation Starling Oncology contracts with managed care providers to take full accountability for the payor’s oncology benefit, from network design through payment adjudication. NETWORK MODEL Hybrid TTM REVENUE 2 $31M EXPECTED MLR 1 ~80 - 85% PMPM $Mid - double digit EXPECTED BENEFITS Recurring revenue with greater scalability Greater revenue per patient through the hybrid model VS. Notes: (1) MLR is defined as payroll, third - party charges, medical supplies plus IV drug costs incurred by Starling Oncology divided by net capitation revenue. (2) Trailing twelve month (TTM) revenue as of September 30, 2026
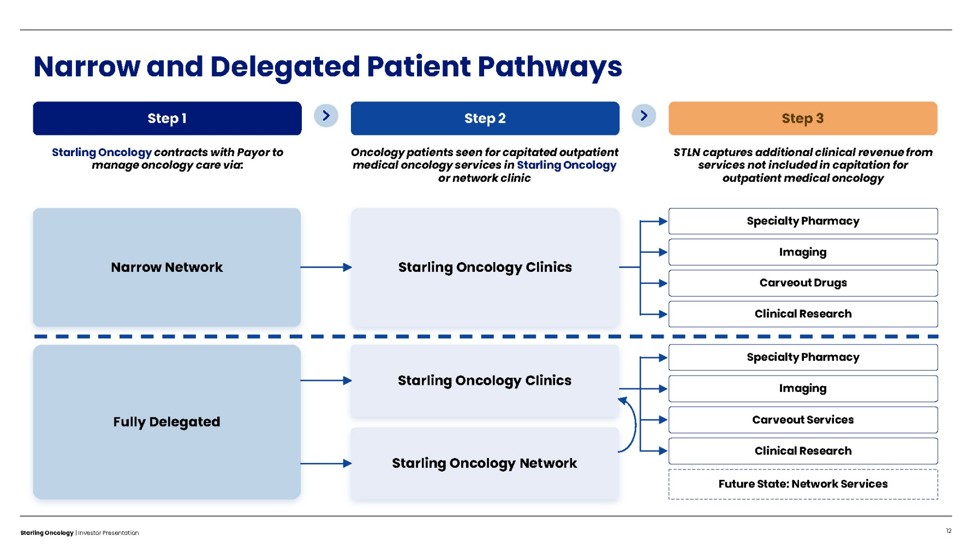
Step 1 Step 2 Step 3 Starling Oncology contracts with Payor to manage oncology care via: Oncology patients seen for capitated outpatient medical oncology services in Starling Oncology or network clinic STLN captures additional clinical revenue from services not included in capitation for outpatient medical oncology Imaging Carveout Drugs Clinical Research Specialty Pharmacy Imaging Carveout Services Clinical Research Future State: Network Services Narrow Network Starling Oncology Clinics Starling Oncology Clinics Starling Oncology Network Fully Delegated Specialty Pharmacy 12 Starling Oncology | Investor Presentation Narrow and Delegated Patient Pathways
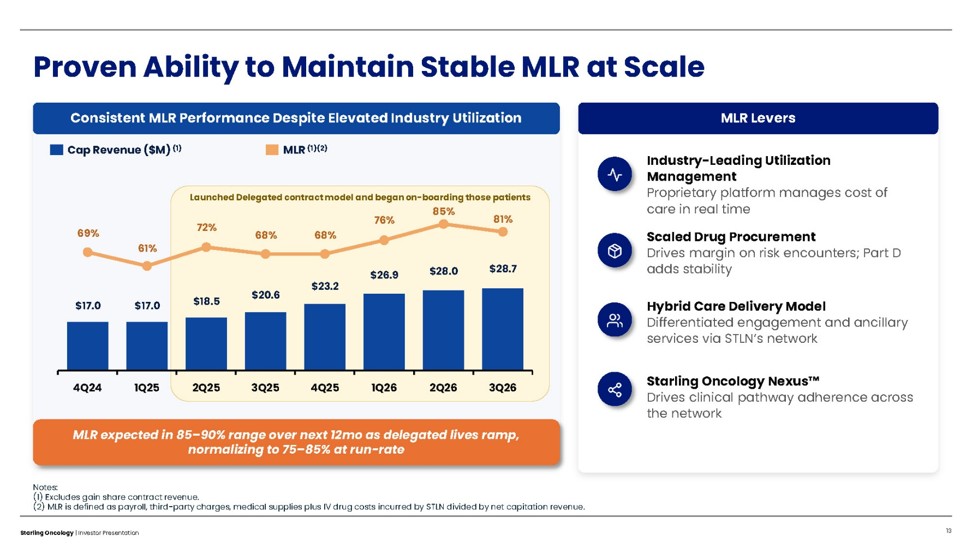
Proven Ability to Maintain Stable MLR at Scale Launched Delegated contract model and began on - boarding those patients 4Q24 1Q25 2Q25 3Q25 4Q25 1Q26 2Q26 3Q26 Consistent MLR Performance Despite Elevated Industry Utilization Cap Revenue ($M) (1) MLR (1)(2) MLR expected in 85 – 90% range over next 12mo as delegated lives ramp, normalizing to 75 – 85% at run - rate $17.0 $17.0 $18.5 $20.6 $23.2 $26.9 $28.0 $28.7 69% 61% 72% 68% 68% 76% 85% 81% MLR Levers Industry - Leading Utilization Management Proprietary platform manages cost of care in real time Scaled Drug Procurement Drives margin on risk encounters; Part D adds stability Hybrid Care Delivery Model Differentiated engagement and ancillary services via STLN’s network Starling Oncology Nexus Drives clinical pathway adherence across the network 13 Starling Oncology | Investor Presentation Notes: (1) Excludes gain share contract revenue. (2) MLR is defined as payroll, third - party charges, medical supplies plus IV drug costs incurred by STLN divided by net capitati on revenue.
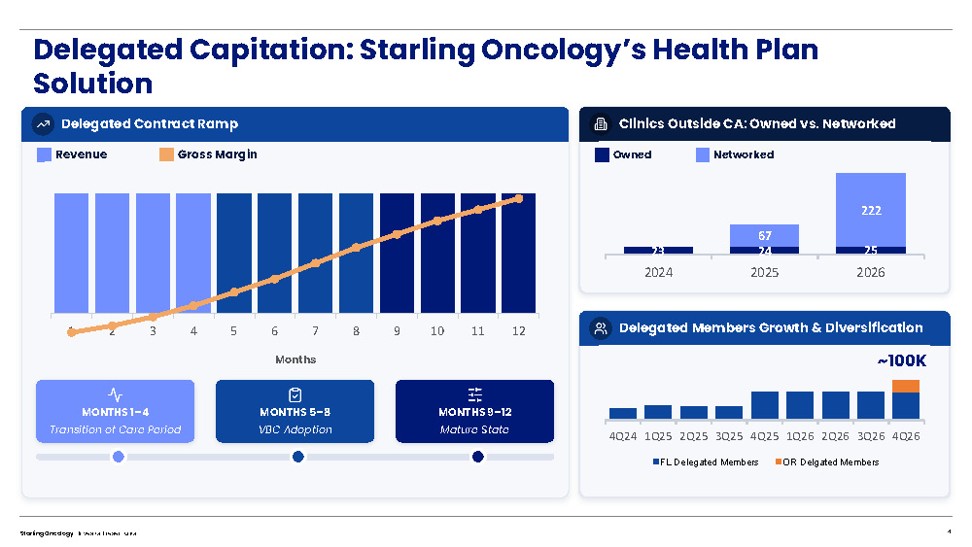
Delegated Contract Ramp Revenue Gross Margin 1 2 3 4 5 6 7 8 9 10 11 12 Months MONTHS 1 – 4 Transition of Care Period MONTHS 5 – 8 VBC Adoption MONTHS 9 – 12 Mature State Clinics Outside CA: Owned vs. Networked 23 24 25 67 222 2024 2025 2026 Delegated Members Growth & Diversification 4Q24 1Q25 2Q25 3Q25 4Q25 1Q26 2Q26 3Q26 4Q26 FL Delegated Members OR Delgated Members Delegated Capitation: Starling Oncology’s Health Plan Solution 14 Starling Oncology | Investor Presentation Owned Networked ~100K RC1
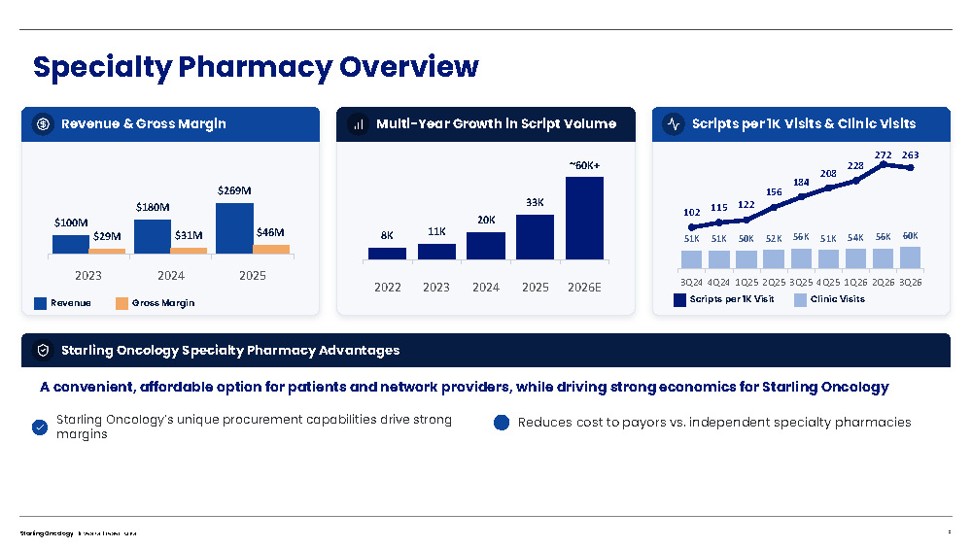
Revenue & Gross Margin $100M $180M $269M $29M $31M $46M 2023 2024 2025 Multi - Year Growth in Script Volume 8K 11K 20K 33K ~60K+ 2022 2023 2024 2025 2026E Scripts per 1K Visits & Clinic Visits 51K 51K 50K 52K 56K 51K 54K 56K 60K 3Q24 4Q24 1Q25 2Q25 3Q25 4Q25 1Q26 2Q26 3Q26 102 115 122 156 184 208 228 272 263 Starling Oncology Specialty Pharmacy Advantages A convenient, affordable option for patients and network providers, while driving strong economics for Starling Oncology Reduces cost to payors vs. independent specialty pharmacies Starling Oncology’s unique procurement capabilities drive strong margins Specialty Pharmacy Overview 15 Starling Oncology | Investor Presentation Revenue Gross Margin Scripts per 1K Visit Clinic Visits
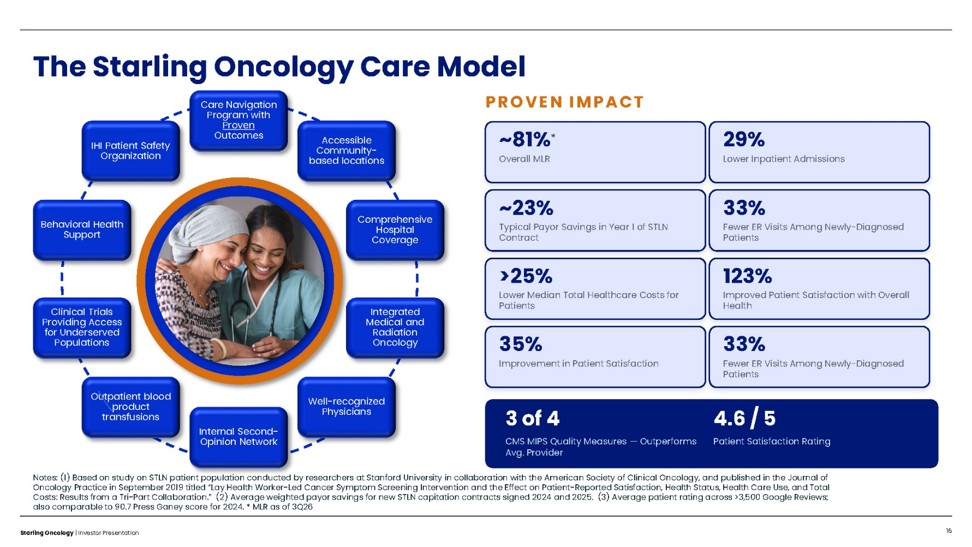
16 Starling Oncology | Investor Presentation The Starling Oncology Care Model Care Navigation Program with Proven Outcomes Accessible Community - based locations Comprehensive Hospital Coverage Integrated Medical and Radiation Oncology Well - recognized Physicians Internal Second - Opinion Network Outpatient blood product transfusions Clinical Trials Providing Access for Underserved Populations Behavioral Health Support IHI Patient Safety Organization PROVEN IMPACT ~81% * Overall MLR 29% Lower Inpatient Admissions ~23% Typical Payor Savings in Year 1 of STLN Contract 33% Fewer ER Visits Among Newly - Diagnosed Patients >25% Lower Median Total Healthcare Costs for Patients 123% Improved Patient Satisfaction with Overall Health 35% Improvement in Patient Satisfaction 33% Fewer ER Visits Among Newly - Diagnosed Patients 3 of 4 CMS MIPS Quality Measures — Outperforms Avg. Provider 4.6 / 5 Patient Satisfaction Rating Notes: (1) Based on study on STLN patient population conducted by researchers at Stanford University in collaboration with th e A merican Society of Clinical Oncology, and published in the Journal of Oncology Practice in September 2019 titled “Lay Health Worker - Led Cancer Symptom Screening Intervention and the Effect on Patien t - Reported Satisfaction, Health Status, Health Care Use, and Total Costs: Results from a Tri - Part Collaboration.” (2) Average weighted payor savings for new STLN capitation contracts signed 2024 and 2025. (3) Average patient rating across >3,500 Google Reviews; also comparable to 90.7 Press Ganey score for 2024. * MLR as of 3Q26
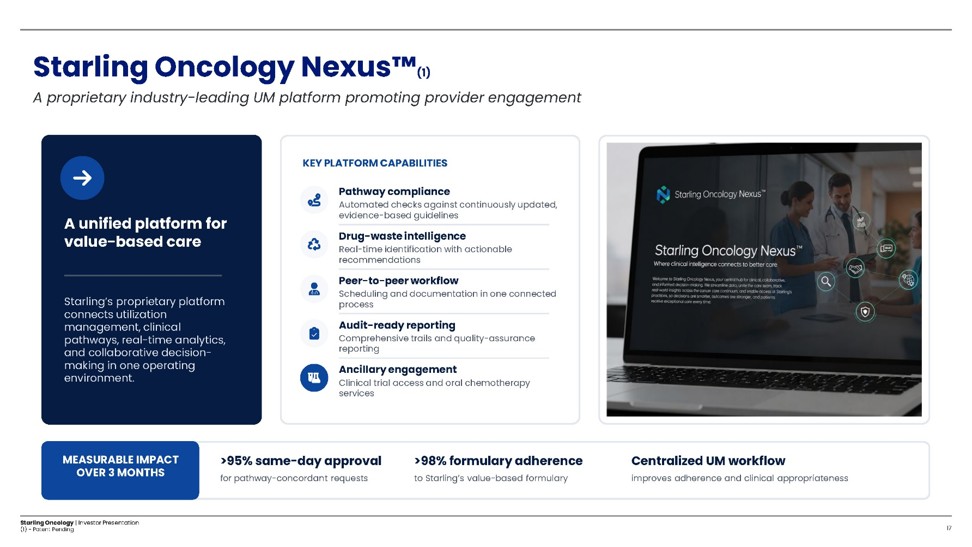
Starling Oncology Nexus (1) A proprietary industry - leading UM platform promoting provider engagement Starling Oncology | Investor Presentation (1) - Patent Pending 17 A unified platform for value - based care Starling’s proprietary platform connects utilization management, clinical pathways, real - time analytics, and collaborative decision - making in one operating environment. KEY PLATFORM CAPABILITIES Pathway compliance Automated checks against continuously updated, evidence - based guidelines Drug - waste intelligence Real - time identification with actionable recommendations Peer - to - peer workflow Scheduling and documentation in one connected process Audit - ready reporting Comprehensive trails and quality - assurance reporting Ancillary engagement Clinical trial access and oral chemotherapy services MEASURABLE IMPACT OVER 3 MONTHS >95% same - day approval for pathway - concordant requests >98% formulary adherence to Starling’s value - based formulary Centralized UM workflow improves adherence and clinical appropriateness
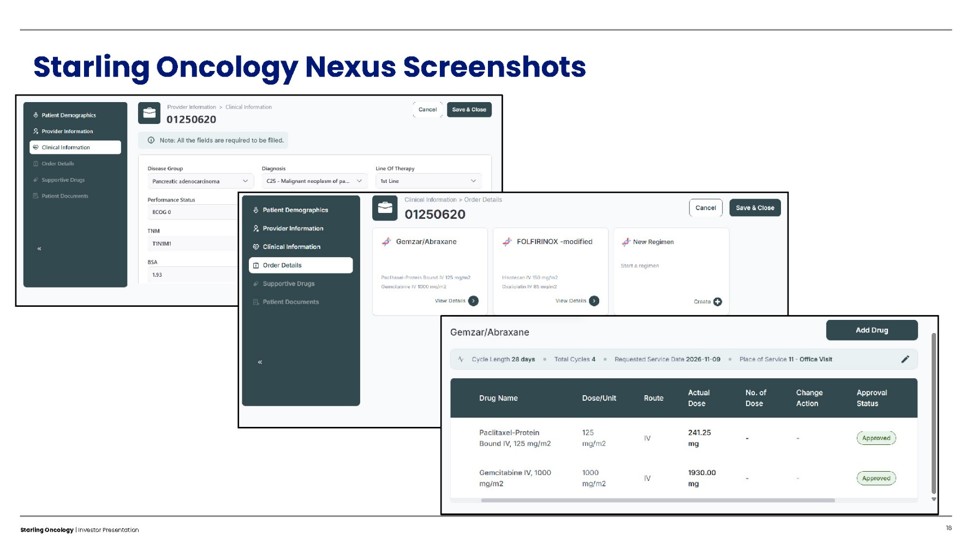
Starling Oncology Nexus Screenshots Starling Oncology | Investor Presentation 18
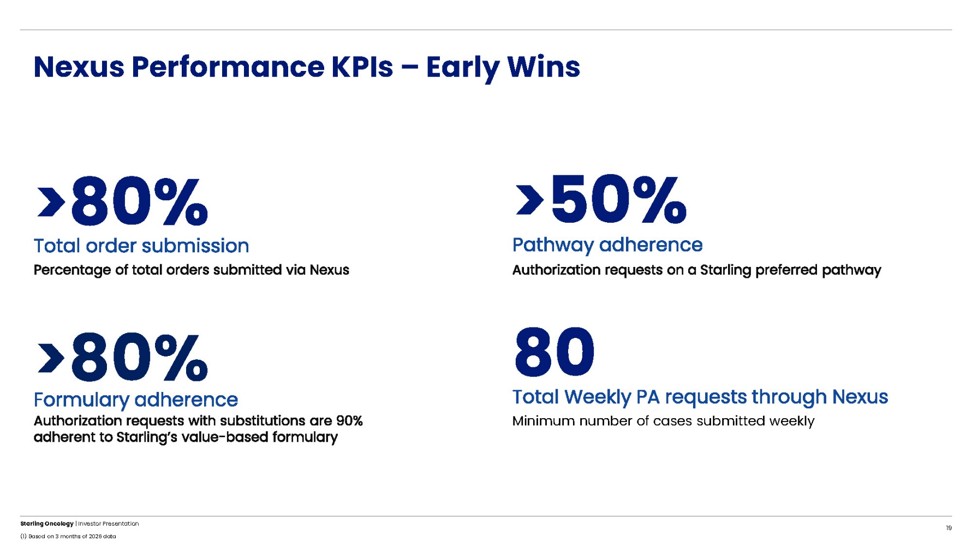
Nexus Performance KPIs – Early Wins Starling Oncology | Investor Presentation (1) Based on 3 months of 2026 data 19 >80% Minimum number of cases submitted weekly
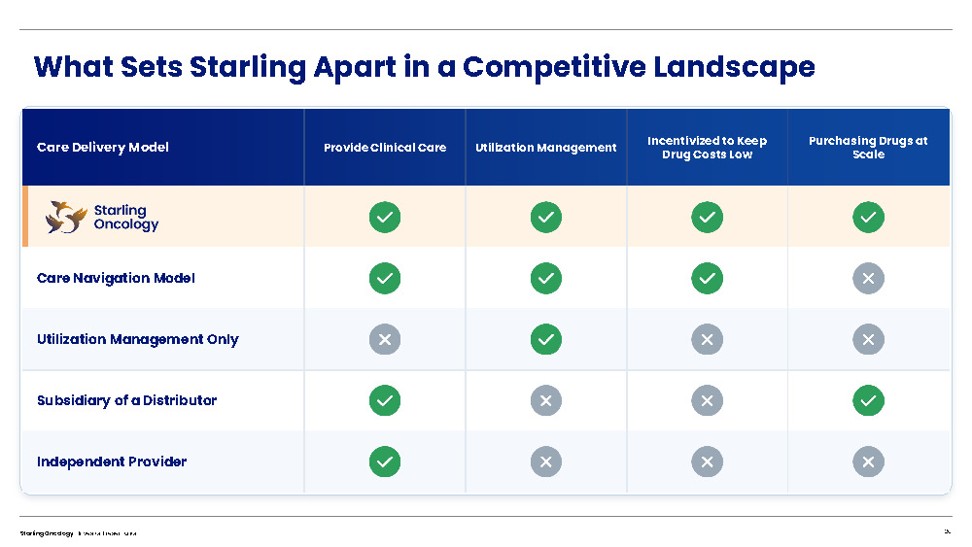
What Sets Starling Apart in a Competitive Landscape 20 Starling Oncology | Investor Presentation Care Delivery Model Provide Clinical Care Utilization Management Incentivized to Keep Drug Costs Low Purchasing Drugs at Scale Care Navigation Model Utilization Management Only Subsidiary of a Distributor Independent Provider
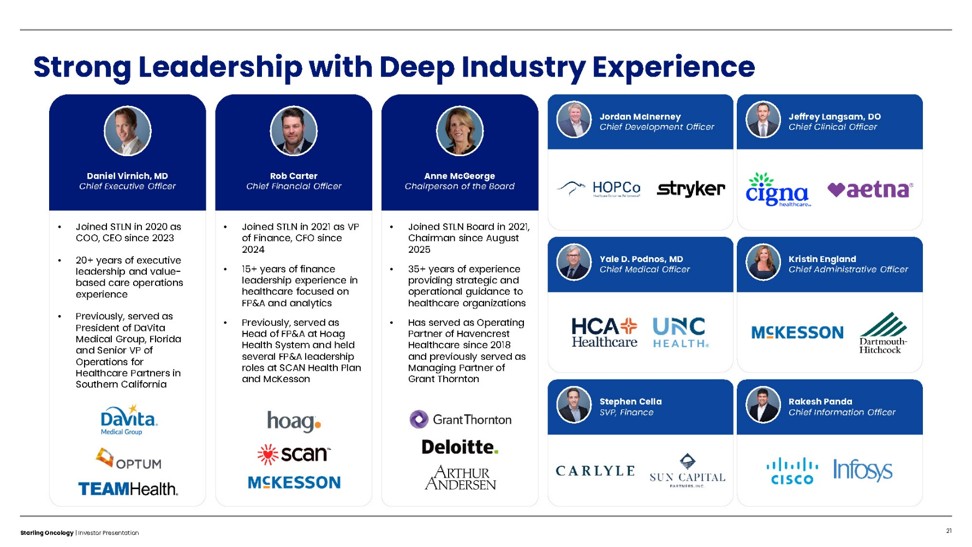
= Daniel Virnich, MD Chief Executive Officer • Joined STLN in 2020 as COO, CEO since 2023 • 20+ years of executive leadership and value - based care operations experience • Previously, served as President of DaVita Medical Group, Florida and Senior VP of Operations for Healthcare Partners in Southern California Rob Carter Chief Financial Officer • Joined STLN in 2021 as VP of Finance, CFO since 2024 • 15+ years of finance leadership experience in healthcare focused on FP&A and analytics • Previously, served as Head of FP&A at Hoag Health System and held several FP&A leadership roles at SCAN Health Plan and McKesson Anne McGeorge Chairperson of the Board • Joined STLN Board in 2021, Chairman since August 2025 • 35+ years of experience providing strategic and operational guidance to healthcare organizations • Has served as Operating Partner of Havencrest Healthcare since 2018 and previously served as Managing Partner of Grant Thornton = Jordan McInerney Chief Development Officer = Jeffrey Langsam, DO Chief Clinical Officer = Yale D. Podnos, MD Chief Medical Officer = Kristin England Chief Administrative Officer = Stephen Cella SVP, Finance = Rakesh Panda Chief Information Officer 21 Starling Oncology | Investor Presentation Strong Leadership with Deep Industry Experience
Financial Overview 22 Starling Oncology | Investor Presentation
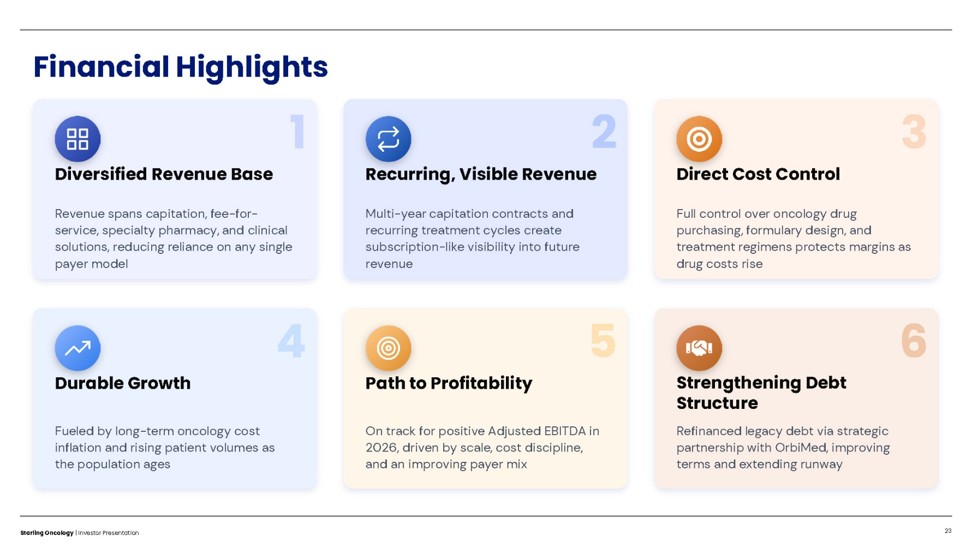
23 Starling Oncology | Investor Presentation Financial Highlights 1 Diversified Revenue Base Revenue spans capitation, fee - for - service, specialty pharmacy, and clinical solutions, reducing reliance on any single payer model 2 Recurring, Visible Revenue Multi - year capitation contracts and recurring treatment cycles create subscription - like visibility into future revenue 3 Direct Cost Control Full control over oncology drug purchasing, formulary design, and treatment regimens protects margins as drug costs rise 4 Durable Growth Fueled by long - term oncology cost inflation and rising patient volumes as the population ages 5 Path to Profitability On track for positive Adjusted EBITDA in 2026, driven by scale, cost discipline, and an improving payer mix 6 Strengthening Debt Structure Refinanced legacy debt via strategic partnership with OrbiMed, improving terms and extending runway
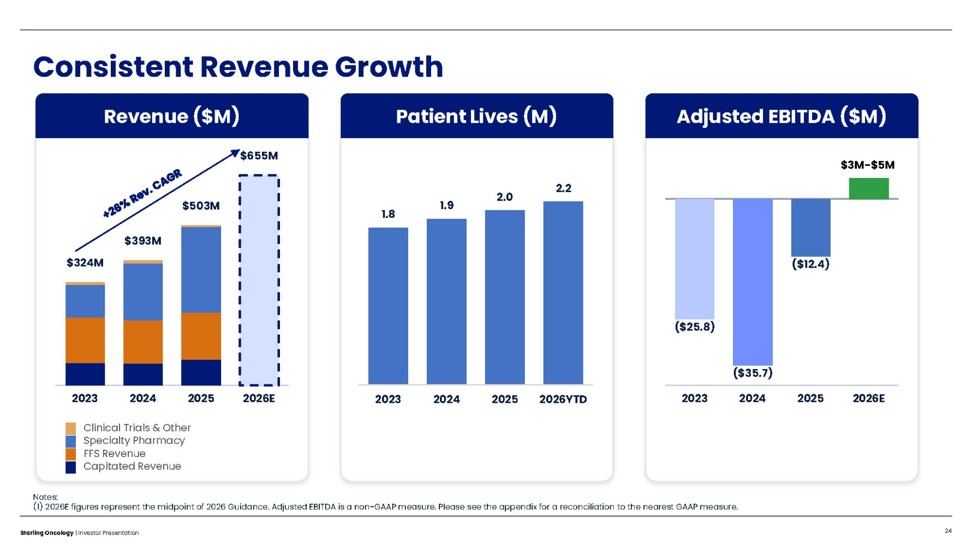
Consistent Revenue Growth 24 Starling Oncology | Investor Presentation Patient Lives (M) Adjusted EBITDA ($M) Revenue ($M) ($35.7) 2024 ($12.4) ($25.8) 2023 2025 $324M 2023 $393M 2024 $503M 2025 Capitated Revenue FFS Revenue Specialty Pharmacy Clinical Trials & Other $655M 2026E $3M - $5M 2026E Notes: (1) 2026E figures represent the midpoint of 2026 Guidance. Adjusted EBITDA is a non - GAAP measure. Please see the appendix for a reconciliation to the nearest GAAP measure. 1.8 1.9 2.0 2.2 2023 2024 2025 2026YTD
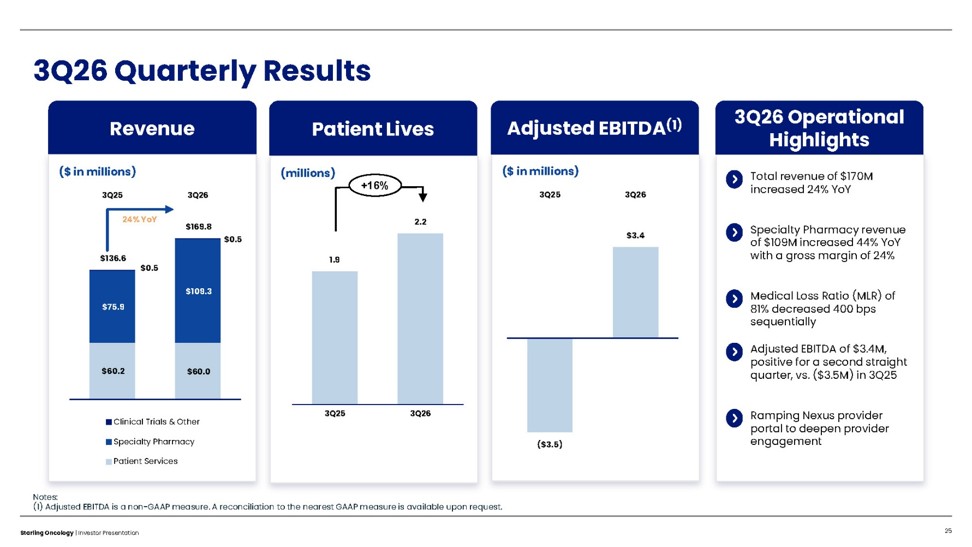
3Q26 Quarterly Results 25 Starling Oncology | Investor Presentation Notes: (1) Adjusted EBITDA is a non - GAAP measure. A reconciliation to the nearest GAAP measure is available upon request. Revenue Adjusted EBITDA (1) Patient Lives 3Q26 Operational Highlights ($ in millions) ($ in millions) (millions) $60.2 $60.0 $75.9 $109.3 $0.5 $0.5 $136.6 $169.8 3Q25 3Q26 Clinical Trials & Other Specialty Pharmacy Patient Services 24% YoY ($3.5) $3.4 3Q25 3Q26 Adjusted EBITDA of $3.4M, positive for a second straight quarter, vs. ($3.5M) in 3Q25 Specialty Pharmacy revenue of $109M increased 44% YoY with a gross margin of 24% Medical Loss Ratio (MLR) of 81% decreased 400 bps sequentially Ramping Nexus provider portal to deepen provider engagement +16% 1.9 2.2 3Q25 3Q26 Total revenue of $170M increased 24% YoY
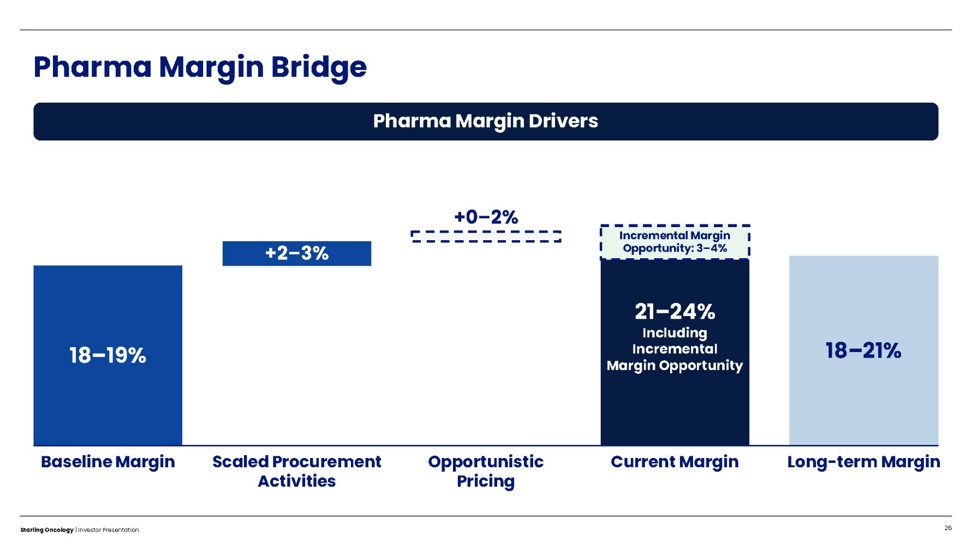
Pharma Margin Bridge Starling Oncology | Investor Presentation 26 Pharma Margin Drivers 18 – 19% +2 – 3% 21 – 24% Including Incremental Margin Opportunity 18 – 21% Baseline Margin Scaled Procurement Activities Opportunistic Pricing Current Margin Long - term Margin +0 – 2% Incremental Margin Opportunity: 3 – 4%
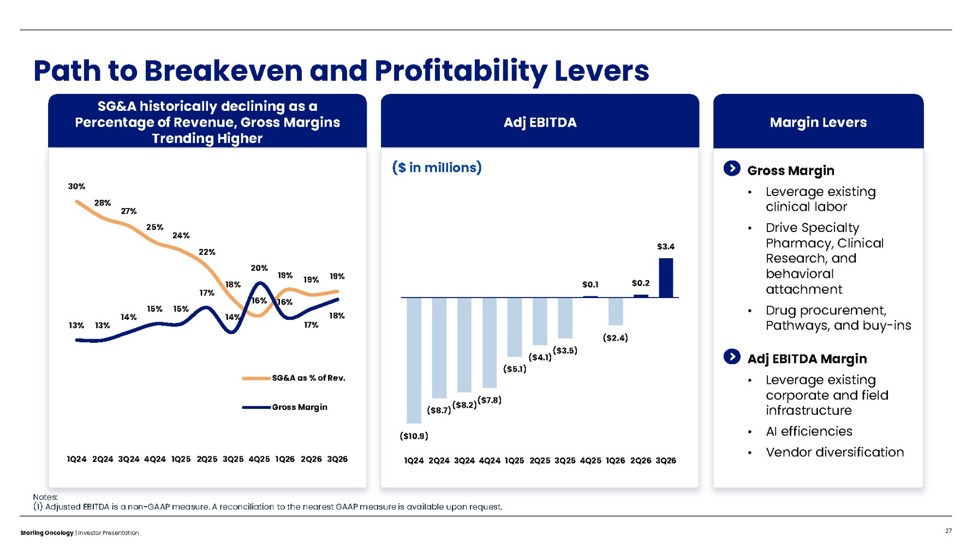
Path to Breakeven and Profitability Levers 27 Starling Oncology | Investor Presentation SG&A historically declining as a Percentage of Revenue, Gross Margins Trending Higher Margin Levers Gross Margin • Leverage existing clinical labor • Drive Specialty Pharmacy, Clinical Research, and behavioral attachment • Drug procurement, Pathways, and buy - ins Adj EBITDA ($ in millions) 30% 28% 27% 25% 24% 22% 18% 16% 19% 19% 19% 13% 13% 14% 15% 15% 17% 14% 20% 16% 17% 18% 1Q24 2Q24 3Q24 4Q24 1Q25 2Q25 3Q25 4Q25 1Q26 2Q26 3Q26 SG&A as % of Rev. Gross Margin ($10.9) ($8.7) ($8.2) ($7.8) ($5.1) ($4.1) ($3.5) $0.1 ($2.4) $0.2 $3.4 1Q24 2Q24 3Q24 4Q24 1Q25 2Q25 3Q25 4Q25 1Q26 2Q26 3Q26 Adj EBITDA Margin • Leverage existing corporate and field infrastructure • AI efficiencies • Vendor diversification Notes: (1) Adjusted EBITDA is a non - GAAP measure. A reconciliation to the nearest GAAP measure is available upon request.
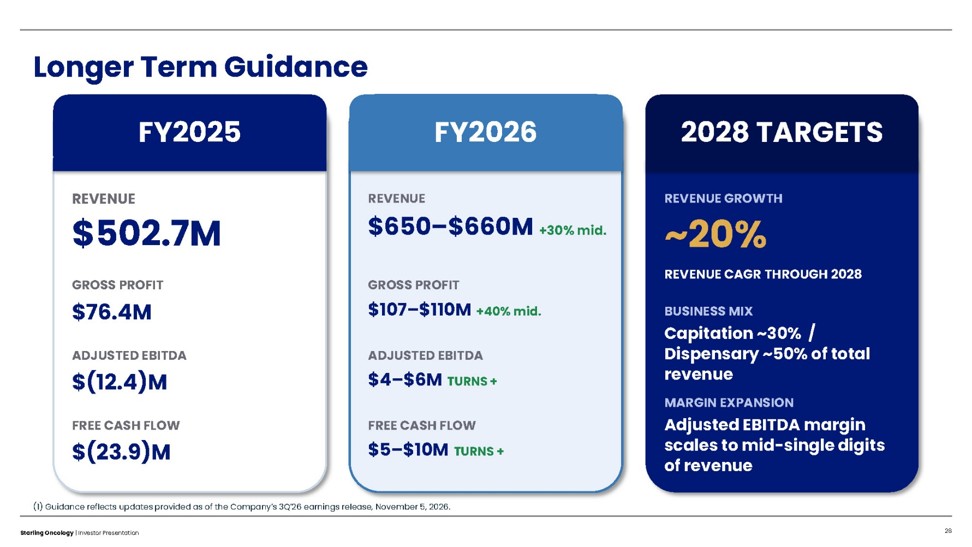
Longer Term Guidance 28 Starling Oncology | Investor Presentation FY2025 FY2026 2028 TARGETS REVENUE $502.7M GROSS PROFIT $76.4M ADJUSTED EBITDA $(12.4)M FREE CASH FLOW $(23.9)M REVENUE $650 – $6 6 0M + 30 % mid. GROSS PROFIT $10 7 – $110M +4 0 % mid. ADJUSTED EBITDA $ 4 – $ 6 M TURNS + FREE CASH FLOW $5 – $1 0 M TURNS + REVENUE GROWTH ~20% REVENUE CAGR THROUGH 2028 BUSINESS MIX Capitation ~30% / Dispensary ~50% of total revenue MARGIN EXPANSION Adjusted EBITDA margin scales to mid - single digits of revenue (1) Guidance reflects updates provided as of the Company’s 3Q’26 earnings release, November 5, 2026.
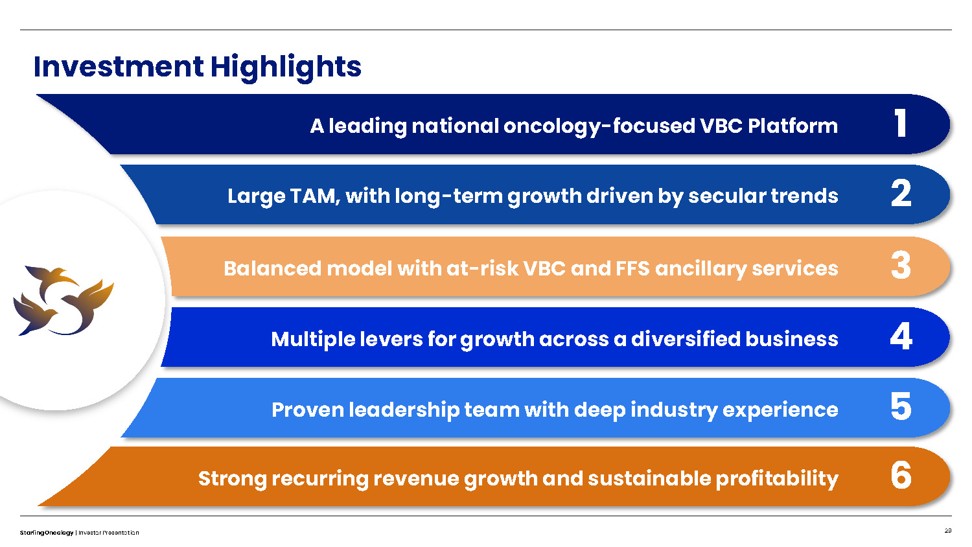
29 Starling Oncology | Investor Presentation 5 4 3 2 1 A leading national oncology - focused VBC Platform Large TAM, with long - term growth driven by secular trends Balanced model with at - risk VBC and FFS ancillary services Multiple levers for growth across a diversified business Proven leadership team with deep industry experience 6 Strong recurring revenue growth and sustainable profitability Investment Highlights